Chebml Database
import marimo as mo
Prioritizing Drug-Like ChEMBL Compounds Within Target Profiles
When reviewing data to find pharma compounds for virtual screening, we might want to check what their target profiles and rank candidates by how many Lipinski’s rule of five violations they have–the fewer the better. Here, a target profile refers to the set of targets a compound is known to be active against. This post uses the ChEMBL API and a SQLite database to do that.
This post pulls data from ChEMBL using its chembl_webresource_client for Python. It’s a helpful package which handles the ChEMBL API calls. It also provides caching so you won’t accidentally run the same queries more than once. APIs often ask users to cache the results; I like that ChEMBL goes ahead and does that for you. (If it didn’t, I would have used DiskCache, which as the name implies caches results to disk so they persist across code runs, and which I’ve found works well for storing results from other API calls.) I also like that the package handles obeying the API rate limit rather than setting a limit in units which may be difficult to measure and then penalizing you for exceeding it.
We write the results directly to a SQLite database. SQLite is file-based so its uptime is nearly 100% as long as your code is running on the same system. That means we don’t need to worry about its availability. Of course it being file-based is not ideal if users are distributed across the Internet, but that’s not what we’re doing here.
Open this notebook in marimo molab or Google Colab so you can run it without installing anything on your computer.
# /// script
# dependencies = [
#     "aiohttp>=3.13.2",
#     "chembl-webresource-client>=0.10.9",
#     "graphviz>=0.21",
#     "ipykernel>=6.29.0",
#     "ipython>=9.10.0",
#     "marimo>=0.19.10",
#     "matplotlib>=3.10.8",
#     "nbconvert>=7.16.6",
#     "nbformat>=5.10.4",
#     "pydot>=4.0.1",
#     "rdkit>=2025.9.5",
#     "ruff>=0.15.1",
#     "sqlalchemy>=2.0.45",
#     "sqlalchemy-schemadisplay>=2.0",
# ]
# ///
Virtual environment setup with uv
To recreate the environment for this notebook, install it with uv:
uv sync
Database schemas—conceptual
I find database entity-relationship diagrams to be useful for planning and documenting.
ChEMBL has the connections as compounds ↔ activities ↔ targets. Let’s plot that as an ERD using graphviz.
import logging
import time
from collections import defaultdict

import pydot
import sqlalchemy
from sqlalchemy import (
    Column,
    Float,
    Integer,
    String,
    create_engine,
    func,
    select,
    UniqueConstraint,
)
from sqlalchemy.dialects.sqlite import insert
from sqlalchemy.exc import IntegrityError, SQLAlchemyError
from sqlalchemy.orm import DeclarativeBase, sessionmaker
from chembl_webresource_client.new_client import new_client
from graphviz import Digraph
from IPython.display import SVG, display
from sqlalchemy_schemadisplay import create_schema_graph
from rdkit import Chem
from rdkit.Chem import MolFromSmiles
from rdkit.Chem.Draw import MolsMatrixToGridImage
from PIL import Image, ImageDraw, ImageFont
We’ll set some parameters for ERDs in graphviz.
# Scale down size of ERD relationship labels and arrowheads
crow_fontsize = "8"  # smaller font for labels
arrow_scale = "0.4"  # smaller arrowheads
# Create the diagram
dot_chembl = Digraph(format="svg")
dot_chembl.attr(rankdir="LR", splines="ortho")
dot_chembl.attr(
    "node", shape="record", fontsize="10", style="filled", fillcolor="lightgrey"
)

# Nodes
dot_chembl.node("Compound", "{Compound|compound_id (PK)}", fillcolor="#A3C1DA")
dot_chembl.node("Activity", "{Activity|activity_id (PK)}", fillcolor="#A3C1DA")
dot_chembl.node("Target", "{Target|target_id (PK)}", fillcolor="#A3C1DA")

# Relationships
dot_chembl.edge(
    "Compound",
    "Activity",
    fontsize=crow_fontsize,
    arrowhead="crow",
    arrowtail="crow",
    dir="both",
    color="black",
    arrowsize=arrow_scale,
)
dot_chembl.edge(
    "Activity",
    "Target",
    fontsize=crow_fontsize,
    arrowhead="crow",
    arrowtail="crow",
    dir="both",
    color="black",
    arrowsize=arrow_scale,
)

# Render inline SVG
svg_chembl = dot_chembl.pipe(format="svg").decode("utf-8")
display(SVG(svg_chembl))

That makes sense as a comprehensive schema; in this code, I wanted to simplify it by connecting compounds to targets directly. So my schema is simply compounds ↔ targets:
# Create the diagram
dot_simple = Digraph(format="svg")
dot_simple.attr(rankdir="LR", splines="ortho")
dot_simple.attr(
    "node", shape="record", fontsize="10", style="filled", fillcolor="lightgrey"
)

# Define nodes
dot_simple.node("Compound", "{Compound|compound_id (PK)}", fillcolor="#A3C1DA")
dot_simple.node("Target", "{Target|target_id (PK)}", fillcolor="#A3C1DA")

# Many-to-many edge (crow's foot at both ends)
dot_simple.edge(
    "Compound",
    "Target",
    fontsize=crow_fontsize,
    arrowhead="crow",
    arrowtail="crow",
    dir="both",
    color="black",
    arrowsize=arrow_scale,
)

# Render inline SVG
svg_simple = dot_simple.pipe(format="svg").decode("utf-8")
display(SVG(svg_simple))

Code setup
# Set logger level to INFO
logging.basicConfig(
    level=logging.INFO,
    format="[%(levelname)s] %(message)s",
    force=True,
)
logger = logging.getLogger(__name__)
Fetching data from ChEMBL
Now let’s get the data from ChEMBL. The chembl_webresource_client new_client provides objects for molecule, activity, and target.
We’ll start with a set of molecules, then fetch associated data. Here we fetch a number of compounds n_compounds starting at ChEMBL ID start_id. Because ChEMBL assigns a ChEMBL ID to not only compounds but also targets, we’ll count how many IDs correspond to compounds.
Then we’ll fetch associated activities (interactions between compounds and targets) for those compounds. Let’s say we’re interested in older (before 2010) studies on humans with IC50 standards and binding assays. We specify those as filters when we ask for the activities. This will serve to limit us to a reasonable number of activities and thus targets.
Then we get target data including its ChEMBL ID, name, type, and organism.
Lastly we associate targets with compounds by creating a list of targets (the compound’s target profile) for each molecule. This will make it easier to populate our database tables.
def get_chembl_molecules(
    n_compounds: int = 2,
    start_id: int = 1,
):
    # Create list of ChEMBL ids (e.g. CHEMBL12)
    chembl_ids = [f"CHEMBL{id}" for id in range(start_id, start_id + n_compounds)]

    molecule = new_client.molecule
    activity = new_client.activity
    target = new_client.target

    # Suppress INFO logs from the chembl package while keeping global INFO level
    logging.getLogger("chembl_webresource_client").setLevel(logging.WARNING)

    # --------------------
    # 1) Fetch molecules
    # --------------------
    mols = list(
        molecule.filter(molecule_chembl_id__in=chembl_ids).only(
            [
                "molecule_chembl_id",
                "molecule_structures",
                "pref_name",
                "molecule_properties",
            ]
        )
    )

    # From the molecules in mols, extract the digits after "CHEMBL" to check which IDs were found
    chembl_ids_found = set()
    for mol in mols:
        chembl_id = mol.get("molecule_chembl_id", "")
        if chembl_id.startswith("CHEMBL"):
            chembl_ids_found.add(int(chembl_id.replace("CHEMBL", "")))
    chembl_ids_found_str = ", ".join(map(str, sorted(chembl_ids_found)))

    logger.info(
        f"Of the {n_compounds} ChEMBL IDs "
        f"({start_id}-{start_id + n_compounds - 1}), {len(mols)} are compounds: "
        f"ChEMBL IDs {chembl_ids_found_str}"
    )

    if not mols:
        return []

    mol_ids_present = [m["molecule_chembl_id"] for m in mols]

    # ---------------------------------
    # 2) Bulk fetch activities → targets
    # ---------------------------------
    activities = activity.filter(
        molecule_chembl_id__in=mol_ids_present,
        target_organism="Homo sapiens",
        standard_type="IC50",
        assay_type="B",
        document_year__lt=2010,
    ).only(
        [
            "molecule_chembl_id",
            "target_chembl_id",
        ]
    )
    logger.info(f"Fetched {len(activities)} activities from ChEMBL.")

    mol_to_target_ids = defaultdict(set)

    for act in activities:
        try:
            mol_to_target_ids[act["molecule_chembl_id"]].add(
                act["target_chembl_id"]
            )
        except Exception as e:
            logger.warning(e)

    # ---------------------------------
    # 3) Fetch target metadata (bulk)
    # ---------------------------------
    all_target_ids = sorted(
        {tar_id for tar_ids in mol_to_target_ids.values() for tar_id in tar_ids}
    )

    # Create dictionary of ChEMLB ID: target entries
    targets = {}
    if all_target_ids:
        for t in target.filter(target_chembl_id__in=all_target_ids).only(
            [
                "target_chembl_id",
                "pref_name",
                "target_type",
                "organism",
            ]
        ):
            targets[t["target_chembl_id"]] = t
    logger.info(f"Fetched metadata for {len(targets)} targets from ChEMBL.")

    # ---------------------------------
    # 4) Attach targets to molecules
    # ---------------------------------

    for m in mols:
        t_ids = mol_to_target_ids.get(m["molecule_chembl_id"], [])
        m["targets"] = [targets[tar_id] for tar_id in t_ids if tar_id in targets]

    return mols, all_target_ids
SQLite database
While we use a SQLite database, we interact with it using SQLAlchemy. SQLAlchemy has the advantage that the code is the same regardless of which database type you use (except for some database-specific idioms), so if you decide to change database type later, you don’t have to rewrite the code that interacts with the database.
Setting up the database
Here we set up the Base and the SQLite database name (compounds.db), then define a Session.
engine = create_engine("sqlite:///compounds.db", echo=False)
Session = sessionmaker(bind=engine)
class Base(DeclarativeBase):
    pass
Now we create a class for each table. In addition to having a database-assigned primary key id, we enforce uniqueness on the ChEMBL ID to make sure we don’t add the same compound or target multiple times to its table.
The final table is a join table between the compound and target tables. We set a uniqueness constraint to ensure that each compound-target pair can be added only once.
class Compound(Base):
    __tablename__ = "compound"

    id = Column(Integer, primary_key=True)
    chembl_id = Column(Integer, unique=True)
    sml = Column(String)
    pref_name = Column(String)
    molwt = Column(Float)  # MolWt
    tpsa = Column(Float)  # TPSA
    num_h_acceptors = Column(Integer)  # NumHAcceptors
    num_h_donors = Column(Integer)  # NumHDonors
    num_ro5 = Column(Integer)  # NumRo5
    mol_logp = Column(Float)  # MolLogP

class Target(Base):
    __tablename__ = "target"

    id = Column(Integer, primary_key=True)
    target_chembl_id = Column(String, unique=True)
    organism = Column(String)
    pref_name = Column(String)
    target_type = Column(String)

class CompoundTarget(Base):
    __tablename__ = "compound_target"

    id = Column(Integer, primary_key=True)
    compound_id = Column(Integer, sqlalchemy.ForeignKey("compound.id"))
    target_id = Column(Integer, sqlalchemy.ForeignKey("target.id"))

    __table_args__ = (
        UniqueConstraint("compound_id", "target_id", name="uq_compound_target"),
    )
Now we define simple functions to reset and initialize the database. These are one-liners so they’re set up as functions, and named, to remind us of what they do.
def reset_db():
    """Drop all database tables (use with caution)."""
    Base.metadata.drop_all(engine)
def init_db():
    """Create database tables (call once at app startup or from scripts/tests)."""
    Base.metadata.create_all(engine)
Visualizing the database schema
Now that we’ve created the database in code, let’s visualize it to make sure it’s as we planned.
def add_ordering_edges(graph, Base, exclude_tables=None):
    """
    Add invisible edges based on foreign key relationships to enforce left-to-right ordering

    Args:
        graph: A pydot.Dot graph object (e.g. ERD) to add edges to.
        Base: SQLAlchemy declarative base containing table metadata.
        exclude_tables: Set of table names to exclude from processing

    Returns:
        The modified graph object with invisible ordering edges added.
    """
    if exclude_tables is None:
        exclude_tables = set()

    # Get all table names
    tables = Base.metadata.tables.keys()

    # For each table, check for foreign keys
    for table_name in tables:
        if table_name in exclude_tables:
            continue

        table = Base.metadata.tables[table_name]

        for fk in table.foreign_key_constraints:
            parent_table = fk.referred_table.name

            if parent_table not in exclude_tables:
                # Add invisible edge: parent -> child
                graph.add_edge(pydot.Edge(parent_table, table_name, style="invis"))

    return graph
# Create the ERD graph
graph_full = create_schema_graph(
    engine=engine,
    metadata=Base.metadata,
    show_datatypes=True,
    show_indexes=False,
    rankdir="LR",
    concentrate=False,
)

# Force strict left-to-right ordering with invisible edges;
# add them programmatically by inspecting the SQLAlchemy model
add_ordering_edges(graph_full, Base)

graph_full.set("splines", "ortho")

# Move FK labels horizontally away from edges
for edge_full in graph_full.get_edges():
    head_full = edge_full.get_headlabel()
    tail_full = edge_full.get_taillabel()

    if head_full:
        clean_head_full = head_full.replace("+ ", "").replace("+", "")
        edge_full.set_headlabel(clean_head_full)

    if tail_full:
        clean_tail_full = tail_full.replace("+ ", "").replace("+", "")
        edge_full.set_taillabel(clean_tail_full)

        edge_full.set_label("")  # critical fix
        edge_full.set_labeldistance("2.5")

# Increase horizontal spacing between tables
graph_full.set("ranksep", "1.0")
svg_content_full = graph_full.create_svg()
display(SVG(svg_content_full))

Let’s simplify the ERD by showing the relationship between the compound and target tables as a many-to-many relationship. We can do that programmatically by detecting the join table, removing it, and replacing it with a (conceptual) many-to-many relationship between the two remaining tables.
# ERD utilities
def detect_join_tables(Base):
    """
    Detect join tables (tables with only an id and two foreign keys).

    Returns:
        dict: Mapping of join_table_name -> (parent_table1, parent_table2)
    """
    join_tables = {}

    for table_name, table in Base.metadata.tables.items():
        # Get foreign key constraints
        fk_constraints = list(table.foreign_key_constraints)

        # A join table typically has:
        # - Only id as primary key (or composite PK of the two FKs)
        # - Exactly 2 foreign key columns
        # - Minimal or no other columns

        foreign_key_columns = []
        for fk in fk_constraints:
            foreign_key_columns.extend(fk.column_keys)

        # Check if this looks like a join table:
        # Has exactly 2 FK constraints pointing to different tables
        if len(fk_constraints) == 2:
            referred_tables = [fk.referred_table.name for fk in fk_constraints]

            # Make sure they point to different tables
            if referred_tables[0] != referred_tables[1]:
                join_tables[table_name] = tuple(referred_tables)

    return join_tables

def get_primary_key_name(Base, table_name):
    """
    Get the primary key column name for a table.

    Args:
        Base: SQLAlchemy declarative base
        table_name: Name of the table

    Returns:
        str: Primary key column name (or comma-separated list if composite)
    """
    table = Base.metadata.tables[table_name]
    pk_columns = [col.name for col in table.columns if col.primary_key]

    if pk_columns:
        return ", ".join(pk_columns)
    else:
        # Fallback
        return "id"

def remove_join_tables_from_graph(graph, Base):
    """
    Remove join tables from graph and replace with direct many-to-many edges.

    Args:
        graph: pydot.Dot graph object
        Base: SQLAlchemy declarative base

    Returns:
        set: Names of removed join tables
    """
    join_tables = detect_join_tables(Base)

    for join_table, (table1, table2) in join_tables.items():
        # Remove the join table node
        graph.del_node(join_table)

        # Remove all edges connected to the join table
        for edge in list(graph.get_edges()):
            if (
                edge.get_source() == join_table
                or edge.get_destination() == join_table
            ):
                graph.del_edge(edge.get_source(), edge.get_destination())

        # Get primary key names for both tables
        table1_pk = get_primary_key_name(Base, table1)
        table2_pk = get_primary_key_name(Base, table2)

        # Add a direct many-to-many edge between the two tables
        graph.add_edge(
            pydot.Edge(
                table1,
                table2,
                taillabel=table1_pk,
                headlabel=table2_pk,
                arrowhead="crow",
                arrowtail="crow",
                dir="both",
            )
        )

    return set(join_tables.keys())
Now we can actually simplify the ERD.
# Create the simplified ERD graph
graph = create_schema_graph(
    engine=engine,
    metadata=Base.metadata,
    show_datatypes=True,
    show_indexes=False,
    rankdir="LR",
    concentrate=False,
)

# Automatically detect and remove join tables
excluded_tables = remove_join_tables_from_graph(graph, Base)

# Add ordering edges (excluding detected join tables)
add_ordering_edges(graph, Base, exclude_tables=excluded_tables)

graph_full.set("splines", "ortho")

# Move FK labels horizontally away from edges
for edge in graph.get_edges():
    head = edge.get_headlabel()
    tail = edge.get_taillabel()

    if head:
        edge.set_headlabel(head)

    if tail:
        edge.set_taillabel(tail)
        edge.set_labeldistance("2.5")

graph_full.set("ranksep", "1.0")

svg_content = graph.create_svg()
display(SVG(svg_content))

Saving data to SQLite database
Now let’s define a function to save our compounds and targets to our SQLite database. To avoid duplication, we start by preloading all the targets into that table and returning the ChEMBL and database ids. The trick is the “returning” part, .returning(Target.target_chembl_id, Target.id). That lets us create a dictionary mapping our input data (ChEMBL ID which we already had) to our database id (which was just created), which is an O(1) (constant time) lookup so we can quickly link the compound to the target. That saves us from having to query the database each time we want to associate a target with a compound.
We do the same for compounds, adding them in bulk, returning their ChEMBL and database ids, and creating a dictionary.
After that, we have the database IDs for both compounds and targets, allowing us to create compound-target records quickly in memory and again bulk adding them to the database without querying the database for the compound or target IDs.
Note that creating the dictionaries does require some RAM, so if you were creating a huge number of records, memory might become a limitation.
def save_compounds_to_db(
    molecules: list[dict], all_target_ids
) -> tuple[int, int, int]:
    """Save multiple compounds and their targets to the database efficiently using bulk inserts."""

    # Deduplicate targets across all molecules
    target_map: dict[str, dict] = {
        t["target_chembl_id"]: {
            "organism": t.get("organism"),
            "pref_name": t.get("pref_name"),
            "target_chembl_id": t.get("target_chembl_id"),
            "target_type": t.get("target_type"),
        }
        for m in molecules
        for t in m.get("targets", [])
        if t.get("target_chembl_id")
    }
    all_targets = list(target_map.values())

    # Build compound records for bulk insert, deduplicating compounds by chembl_id
    compound_map_input: dict[str, dict] = {}
    for mol in molecules:
        chembl_id = mol.get("molecule_chembl_id")
        if not chembl_id or chembl_id in compound_map_input:
            continue
        props = mol.get("molecule_properties") or {}
        compound_map_input[chembl_id] = {
            "chembl_id": chembl_id,
            "sml": (mol.get("molecule_structures") or {}).get("canonical_smiles"),
            "pref_name": mol.get("pref_name"),
            "molwt": props.get("full_molweight"),
            "tpsa": props.get("tpsa"),
            "num_h_acceptors": props.get("num_h_acceptors"),
            "num_h_donors": props.get("num_h_donors"),
            "num_ro5": props.get("num_ro5_violations"),
            "mol_logp": props.get("alogp"),
        }

    compound_records = list(compound_map_input.values())

    n_targets_saved = 0
    n_mols_saved = 0
    n_compounds_targets_saved = 0

    with Session() as db_session:
        try:
            # Bulk insert targets, get back chembl_id -> db id mapping
            existing_targets: dict[str, int] = {}
            if all_targets:
                result = db_session.execute(
                    insert(Target)
                    .on_conflict_do_nothing(index_elements=["target_chembl_id"])
                    .returning(Target.target_chembl_id, Target.id),
                    all_targets,
                )
                existing_targets = {row.target_chembl_id: row.id for row in result}

                # Fetch any pre-existing targets that were skipped by on_conflict_do_nothing
                all_target_chembl_ids = [t["target_chembl_id"] for t in all_targets]
                missing_target_ids = [
                    tid
                    for tid in all_target_chembl_ids
                    if tid not in existing_targets
                ]
                if missing_target_ids:
                    rows = db_session.execute(
                        select(Target.target_chembl_id, Target.id).where(
                            Target.target_chembl_id.in_(missing_target_ids)
                        )
                    )
                    existing_targets.update(
                        {row.target_chembl_id: row.id for row in rows}
                    )
                n_targets_saved = len(existing_targets)

            # Bulk insert compounds, get back chembl_id -> db id mapping
            result = db_session.execute(
                insert(Compound)
                .on_conflict_do_nothing(index_elements=["chembl_id"])
                .returning(Compound.chembl_id, Compound.id),
                compound_records,
            )
            compound_map = {row.chembl_id: row.id for row in result}

            # Fetch any pre-existing compounds that were skipped by on_conflict_do_nothing
            all_chembl_ids = [c["chembl_id"] for c in compound_records]
            missing_compound_ids = [
                cid for cid in all_chembl_ids if cid not in compound_map
            ]
            if missing_compound_ids:
                rows = db_session.execute(
                    select(Compound.chembl_id, Compound.id).where(
                        Compound.chembl_id.in_(missing_compound_ids)
                    )
                )
                compound_map.update({row.chembl_id: row.id for row in rows})
            n_mols_saved = len(compound_map)

            # Build all CompoundTarget join rows in memory
            compound_target_records = []
            seen_pairs = set()
            for mol in molecules:
                chembl_id = mol.get("molecule_chembl_id")
                compound_id = compound_map.get(chembl_id)
                if not compound_id:
                    logger.warning(
                        f"No DB id found for compound {chembl_id}, skipping its targets"
                    )
                    continue

                for target_data in mol.get("targets", []):
                    target_chembl_id = target_data.get("target_chembl_id")
                    target_id = existing_targets.get(target_chembl_id)
                    if not target_id:
                        logger.warning(
                            f"No DB id found for target {target_chembl_id}, skipping"
                        )
                        continue
                    pair = (compound_id, target_id)
                    if pair in seen_pairs:
                        continue
                    seen_pairs.add(pair)
                    compound_target_records.append(
                        {"compound_id": compound_id, "target_id": target_id}
                    )

            # Bulk insert all CompoundTarget join rows
            if compound_target_records:
                db_session.execute(
                    insert(CompoundTarget).on_conflict_do_nothing(
                        index_elements=["compound_id", "target_id"]
                    ),
                    compound_target_records,
                )
                n_compounds_targets_saved = len(compound_target_records)

            db_session.commit()

        except IntegrityError as e:
            logger.info(f"IntegrityError while saving: {e}")
            db_session.rollback()
        except SQLAlchemyError as e:
            logger.exception(f"Database error saving compounds: {e}")
            db_session.rollback()
            raise

    return n_mols_saved, n_targets_saved, n_compounds_targets_saved
Let’s go ahead and set up the database.
# Reset database
reset_db()

# Ensure tables exist
init_db()
Now let’s actually get the molecules from ChEMBL and save them to our SQLite database.
# Measure how long it takes to fetch ChEMBL molecules
start = time.time()
mols, all_target_ids = get_chembl_molecules(
    start_id=796,
    n_compounds=14,
)

end = time.time()
logger.info(
    f"Fetched {len(mols)} molecules and associated activities in {end - start:.2f} seconds from ChEMBL."
)

start = time.time()

n_mols_saved, n_targets_saved, n_compounds_targets_saved = save_compounds_to_db(
    mols, all_target_ids
)
logger.info(
    f"Saved {n_mols_saved} compounds, "
    f"{n_targets_saved} targets, "
    f"and {n_compounds_targets_saved} compound-target associations to the database, "
    f"in {time.time() - start:.2f} seconds."
)
[INFO] Of the 14 ChEMBL IDs (796-809), 12 are compounds: ChEMBL IDs 796, 797, 799, 800, 801, 802, 803, 804, 806, 807, 808, 809


[INFO] Fetched 26 activities from ChEMBL.


[INFO] Fetched metadata for 16 targets from ChEMBL.


[INFO] Fetched 12 molecules and associated activities in 0.01 seconds from ChEMBL.


[INFO] Saved 12 compounds, 16 targets, and 19 compound-target associations to the database, in 0.00 seconds.
Getting compound-target results
Now we can get the results we’re interested in.
Grouping compounds by target profiles
First we’ll simply group the compounds by target profiles. We list the compounds for each set of targets, ordering the compounds within a target profile by ChEMBL ID.
with Session() as db_session1:
    # For each compound, concatenate its targets with a slash.
    # Then, count how many distinct such tuples exist in the database and list them in order of ChEMBL ID.

    # Build per-compound target profile subquery:
    # as correlated scalar subquery: group_concat over an ordered selection of types to ensure consistent ordering.

    # correlated inner select returning pref_name for the current Compound, ordered
    inner = (
        select(Target.pref_name)
        .select_from(
            Target.__table__.join(
                CompoundTarget.__table__, CompoundTarget.target_id == Target.id
            )
        )
        .where(CompoundTarget.compound_id == Compound.id)
        .order_by(func.lower(Target.pref_name))
        .correlate(Compound)
    )

    # name the derived table so the outer group_concat can select from it
    ordered_targets = inner.subquery("ordered_targets")

    # aggregate the ordered names with a '\' separator
    target_profile_subq = select(
        func.group_concat(ordered_targets.c.pref_name, "\\")
    ).scalar_subquery()

    # Create a subquery that selects each compound's id and its target profile.
    target_profiles = db_session1.query(
        Compound.id.label("compound_id"),
        target_profile_subq.label("target_profile"),
    ).subquery()

    # Ensure compounds will be ordered by their ChEMBL ID
    subq = (
        db_session1.query(
            target_profiles.c.target_profile,
            Compound.chembl_id,
        )
        .join(Compound, Compound.id == target_profiles.c.compound_id)
        .order_by(Compound.chembl_id)
    ).subquery()

    # Create a list of distinct type combinations and their counts
    # where each is a tuple like (target profile, # compounds, compound ChEMBL IDs)
    compound_targets = (
        db_session1.query(
            subq.c.target_profile,
            func.count().label("num_compounds"),
            func.group_concat(subq.c.chembl_id, ", ").label("chembl_ids"),
        )
        .group_by(subq.c.target_profile)
        .order_by(subq.c.target_profile)
        .all()
    )

    # Print out the results
    n_compound_by_target = 0
    logger.info("1. Distinct compound target profiles and their counts:")
    for target_profile, count, chembl_ids in compound_targets:
        logger.info(f"    {target_profile}: {count} (Compounds: {chembl_ids})")
        n_compound_by_target += count
    logger.info(
        f"    Total compounds counted by target profiles: {n_compound_by_target}"
    )
[INFO] 1. Distinct compound target profiles and their counts:


[INFO]     None: 4 (Compounds: CHEMBL797, CHEMBL801, CHEMBL802, CHEMBL804)


[INFO]     Androgen receptor\Steroid 17-alpha-hydroxylase/17,20 lyase: 1 (Compounds: CHEMBL806)


[INFO]     Glutamate NMDA receptor; GRIN1/GRIN2B\Solute carrier family 22 member 1: 1 (Compounds: CHEMBL807)


[INFO]     Lanosterol 14-alpha demethylase\Malate dehydrogenase, cytoplasmic: 1 (Compounds: CHEMBL808)


[INFO]     Phosphodiesterase 1\Phosphodiesterase 3: 1 (Compounds: CHEMBL799)


[INFO]     Prostaglandin G/H synthase 1\Prostaglandin G/H synthase 2: 1 (Compounds: CHEMBL800)


[INFO]     Proto-oncogene tyrosine-protein kinase Src\Thymidine kinase 2, mitochondrial\Thymidine kinase, cytosolic: 1 (Compounds: CHEMBL803)


[INFO]     Sodium-dependent dopamine transporter\Sodium-dependent noradrenaline transporter\Sodium-dependent serotonin transporter: 2 (Compounds: CHEMBL796, CHEMBL809)


[INFO]     Total compounds counted by target profiles: 12
For example, a set with multiple targets is listed as
Sodium-dependent dopamine transporter\Sodium-dependent noradrenaline transporter\Sodium-dependent serotonin transporter
I used the backslash \ as the delimiter between a target because a target name can contain other commonly-used delimiters such as as forward slashes /, commas ,, and semicolons ;.
By the way, these three targets are closely-related monoamine transporters which regulate concentrations of extracellular monoamine neurotransmitters and are associated with mental health conditions such as Parkinson’s, ADHD, and depression.
Ranking compounds by rule of 5 violations
Now let’s do an initial ranking of compounds within each target set by how many Lipinski’s rule of five violations they have—the fewer the better. We’ll hide the compounds that don’t have any associated targets.
with Session() as db_session2:
    # Query compounds grouped by type and ordered by ascending number of Rule of 5 violations
    compounds_by_ro5 = (
        db_session2.query(
            target_profiles.c.target_profile,
            Compound.chembl_id,
            Compound.pref_name,
            Compound.num_ro5,
            Compound.sml,
        )
        .join(Compound, Compound.id == target_profiles.c.compound_id)
        .order_by(
            target_profiles.c.target_profile,
            Compound.num_ro5,
        )
        .all()
    )
    logger.info(
        "2. Compounds grouped by target profile and ordered by descending number of Rule of 5 violations:"
    )
    logger.info("        Rule of 5 violation count")
    current_target_profile_ro5 = ""
    for (
        target_profile_ro5,
        chembl_id_ro5,
        pref_name_ro5,
        num_ro5,
        sml_ro5,
    ) in compounds_by_ro5:
        if target_profile_ro5 is None:
            continue
        if target_profile_ro5 != current_target_profile_ro5:
            current_target_profile_ro5 = target_profile_ro5
            logger.info(f"    target profile: {current_target_profile_ro5}")
        logger.info(
            f"        {num_ro5} for {pref_name_ro5.casefold() if pref_name_ro5 else ''} ({chembl_id_ro5})"
        )
[INFO] 2. Compounds grouped by target profile and ordered by descending number of Rule of 5 violations:
[INFO] Rule of 5 violation count
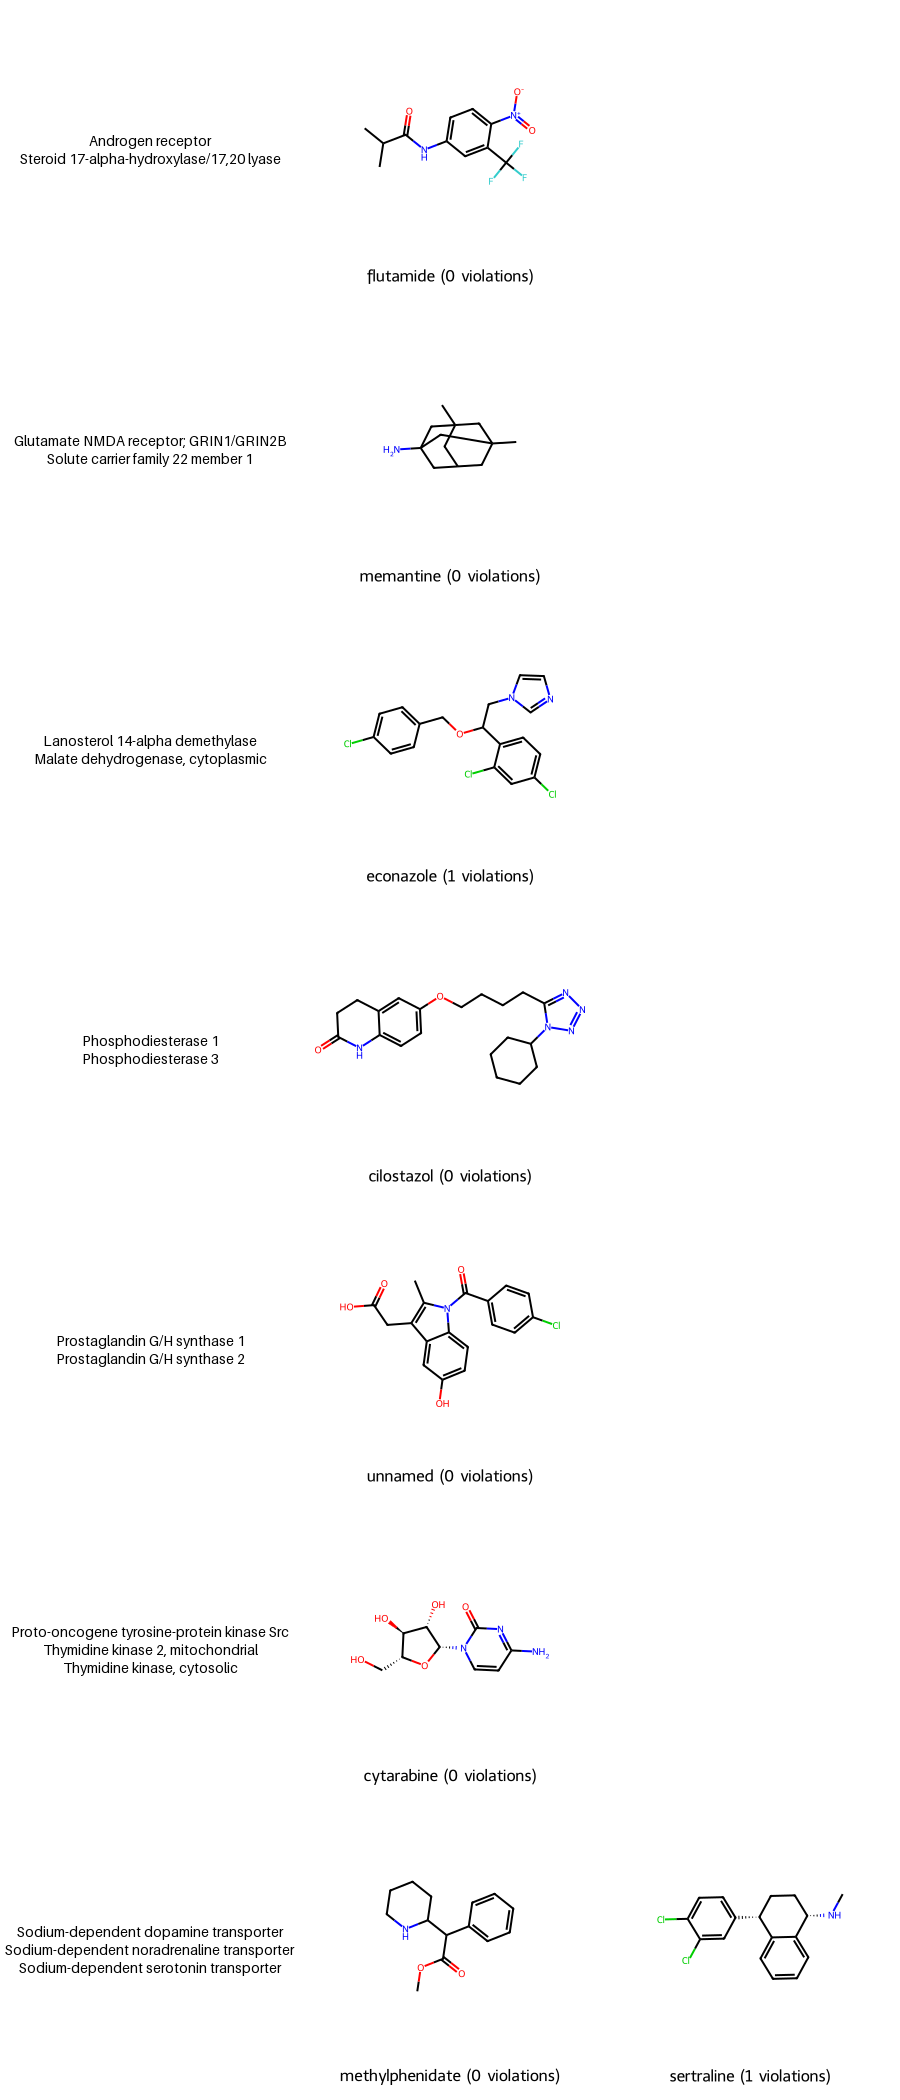
[INFO] target profile: Androgen receptor\Steroid 17-alpha-hydroxylase/17,20 lyase
[INFO] 0 for flutamide (CHEMBL806)
[INFO] target profile: Glutamate NMDA receptor; GRIN1/GRIN2B\Solute carrier family 22 member 1
[INFO] 0 for memantine (CHEMBL807)
[INFO] target profile: Lanosterol 14-alpha demethylase\Malate dehydrogenase, cytoplasmic
[INFO] 1 for econazole (CHEMBL808)
[INFO] target profile: Phosphodiesterase 1\Phosphodiesterase 3
[INFO] 0 for cilostazol (CHEMBL799)
[INFO] target profile: Prostaglandin G/H synthase 1\Prostaglandin G/H synthase 2
[INFO] 0 for (CHEMBL800)
[INFO] target profile: Proto-oncogene tyrosine-protein kinase Src\Thymidine kinase 2, mitochondrial\Thymidine kinase, cytosolic
[INFO] 0 for cytarabine (CHEMBL803)
[INFO] target profile: Sodium-dependent dopamine transporter\Sodium-dependent noradrenaline transporter\Sodium-dependent serotonin transporter
[INFO] 0 for methylphenidate (CHEMBL796)
[INFO] 1 for sertraline (CHEMBL809)
So for example if we’re interested in the target set Sodium-dependent dopamine transporter\Sodium-dependent noradrenaline transporter\Sodium-dependent serotonin transporter, we’d probably consider methylphenidate because it has zero Rule of 5 violations before sertraline that has one violation.
Visualizing the results for small-molecule compounds
If you’ve read my blog you can guess I can’t resist showing these small-molecule compounds. Let’s use my RDKit contribution MolsMatrixToGridImage to show the compounds where
- each row is a target profile
- each column is a compound for that target profile–MolsMatrixToGridImage is useful because there can be a variable number of compounds per target profile.
MolsMatrixToGridImage (and MolsToGridImage) lets you specify a legend for each cell, which appears below the molecular drawing as small text. In the following graphic, the first column doesn’t have any molecules, just the names of the biological targets, so we want to maximize the size of that text and put it where the molecular drawing would be. So we create a helper function make_text_cell to make that large text, then use the paste method of the PNG image to add that text to each cell in the first column.
from PIL import Image, ImageDraw, ImageFont
import io

# Group compounds by target_profile
grouped = defaultdict(list)
for target_profile_b, _, pref_name_b, num_ro5_b, sml_b in compounds_by_ro5:
    if target_profile_b is None:
        continue
    grouped[target_profile_b].append((pref_name_b, num_ro5_b, sml_b))

# Build matrix of mols and legends
mols_matrix = []
legends_matrix = []
blank_mol = Chem.MolFromSmiles("*")

def make_text_cell(text, size=(300, 300)):
    """Create a PIL image with centered text for the target profile cell."""
    img = Image.new("RGB", size, "white")
    draw = ImageDraw.Draw(img)
    font = ImageFont.load_default(size=14)
    # Word-wrap by splitting on newlines first
    lines = text.replace("\\", "\n").split("\n")
    # Compute total text block height
    line_height = draw.textbbox((0, 0), "A", font=font)[3] + 4
    total_height = line_height * len(lines)
    y = (size[1] - total_height) / 2
    for line in lines:
        bbox = draw.textbbox((0, 0), line, font=font)
        x = (size[0] - (bbox[2] - bbox[0])) / 2
        draw.text((x, y), line, fill="black", font=font)
        y += line_height
    return img

target_profile_images = {}

for target_profile_b, compounds in grouped.items():
    # Create a PIL image with the target profile text drawn on it
    cell_img = make_text_cell(target_profile_b)
    target_profile_images[target_profile_b] = cell_img

    mol_row = [blank_mol]
    legend_row = [""]  # Empty legend for the first cell
    for pref_name_b, num_ro5_b, sml_b in compounds:
        mol = MolFromSmiles(sml_b) if sml_b else None
        mol_row.append(mol)
        legend = f"{pref_name_b or 'unnamed'} ({num_ro5_b} violations)"
        legend_row.append(legend.casefold())
    mols_matrix.append(mol_row)
    legends_matrix.append(legend_row)

# Generate grid image
grid_img = MolsMatrixToGridImage(
    molsMatrix=mols_matrix,
    legendsMatrix=legends_matrix,
    subImgSize=(300, 300),
)

# Paste target profile text images over the first column's blank cells
SUB_W, SUB_H = 300, 300
# MolsMatrixToGridImage stacks rows top-to-bottom; each row is SUB_H pixels tall
# (legends add height, but the molecule area starts at row_index * SUB_H)
for row_idx, (target_profile_b, _) in enumerate(grouped.items()):
    cell_img = target_profile_images[target_profile_b]
    x = 0
    y = row_idx * SUB_H
    grid_img.paste(cell_img, (x, y))

grid_img
Revisions
This post was updated on May 19, 2026 to increase the size of the target names in the small-molecule compounds visualization.