MolsMatrixToGridImage Simplifies Code
I contributed MolsMatrixToGridImage to the RDKit 2023.09.1 release because I found myself writing similar code over and over to draw row-and-column grids of molecules. For projects where each row represented something, such as a molecule and the fragments off a common core, my mental model corresponded to a two-dimensional (nested) data structure, whereas the pre-existing function MolsToGridImage supported only linear (flat) data structures.

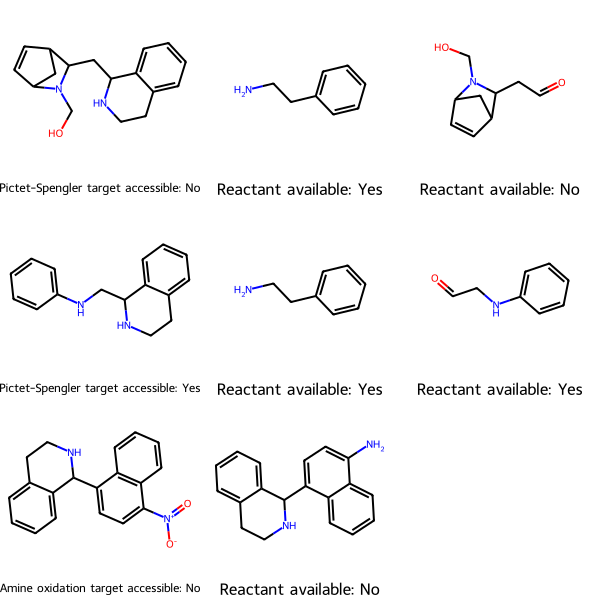
Using MolsMatrixToGridImage can save a considerable amount of code. The most extreme example is from my post Are the Starting Materials for Synthesizing Your Target Molecules Commercially Available?. Using MolsMatrixToGridImage requires only one line of code:
dwg = Draw.MolsMatrixToGridImage(molsMatrix=mols_2D, legendsMatrix=legends_2D)
whereas using MolsToGridImage requires 19 logical lines of code (LLOC) with a total of 45 lines of code (LOC) including three utility functions:
    # Create null molecule (has no atoms) as filler for empty molecule cells in molecular grid plot of results
    null_mol = Chem.MolFromSmiles("")
    pad_rows(mols_2D, longest_row(mols_2D), filler=null_mol)
    pad_rows(legends_2D, longest_row(mols_2D))

    mols = flatten_twoD_list(mols_2D)
    legends = flatten_twoD_list(legends_2D)

    dwg = Draw.MolsToGridImage(mols=mols, legends=legends, molsPerRow=len(mols_2D[0]))

def flatten_twoD_list(twoD_list: list[list]) -> list:
    """
    Flatten a 2D (nested) list into a 1D (non-nested) list

    :param twoD_list: The 2D list, e.g. [[a], [b, c]]
    :returns: 1D list, e.g. [a, b, c]
    """
    flat_list = []
    for row in twoD_list:
        for item in row:
            flat_list += [item]
    return flat_list

def longest_row(twoD_list: list[list]) -> int:
    """
    Find the longest row (sublist) a 2D (nested) list

    :param twoD_list: The 2D list, e.g. [[a], [b, c]]
    :returns: Length of the longest row, e.g. 2
    """
    return max(len(row) for row in twoD_list)

def pad_rows(twoD_list: list[list], row_length: int, filler = "") -> list[list]:
    """
    Pad each row (sublist) in a 2D (nested) list to a given length

    :param twoD_list: The 2D list, e.g. [[a], [b, c]]
    :param row_length: The length to pad to, e.g. 3
    :param filler: The sublist element to pad with, e.g. p
    :returns: Padded 2D list, e.g. [[a, p, p], [b, c, p]]
    """
    for row in twoD_list:
        padding = row_length - len(row)
        row += [filler] * padding
    return twoD_list
I refactored four blog posts that used MolsToGridImage to use MolsMatrixToGridImage if available in the current Python environment, that is if you have the RDKit 2023.09.1 or later:
- Are the Starting Materials for Synthesizing Your Target Molecules Commercially Available?
- Draw a Mass Spectrometry Fragmentation Tree Using RDKit
- Find the Maximum Common Substructure, and Groups Off It, For a Set of Molecules Using RDKit
- RDKit Utility to Visualize Retrosynthetic Analysis Hierarchically
I also made a new blog post where MolsMatrixToGridImage simplifies code by allowing the molecular grid image, and a graph, to be driven by the same nested data structure.